What Causes the Aurora?
This is only a brief description. As the sun rotates on its axis, it generates an interplanetary magnetic field (IMF). The solar wind carries the IMF to the outer reaches of the solar system. The solar wind constantly varies in speed and density of the charged particles it carries. When the IMF encounters earth’s magnetic field most of the particles are deflected so they don’t erode our atmosphere. These particles are concentrated around earth’s poles. But some of the particles do penetrate the earth’s ionosphere where they collide with oxygen and nitrogen atoms and light up. This is what produces the lights that we call the aurora. To get a more intense aurora that can be seen in the mid latitudes the sun needs to erupt with a Coronal Mass Ejection (CME). This usually originates from a sunspot. A CME may accompany a strong solar flare but does not always. When a CME impacts earth’s magnetic field, charged particles are pushed towards the equator and thus the aurora is seen at lower latitudes.
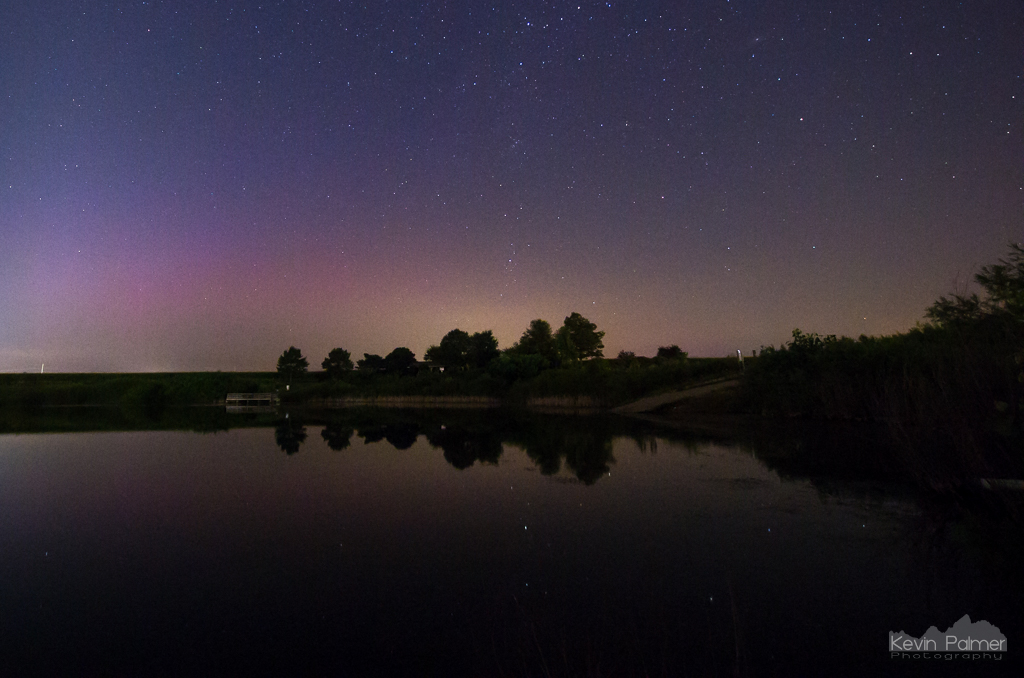
Occasionally the aurora is out but it’s below the threshold of human vision and only a camera can see it. It’s called ‘deep sky aurora’. This was taken from Washington, Illinois, and the KP index was about 5.
KP Index
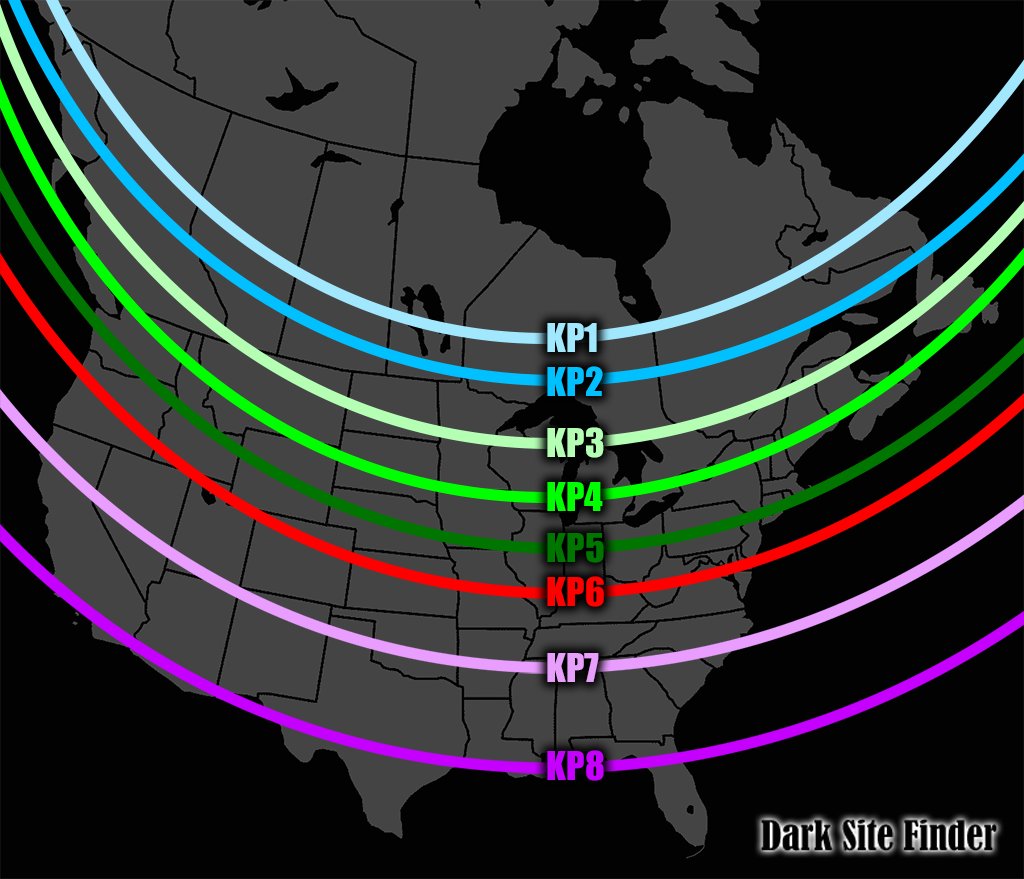
Geomagnetic activity is rated on a scale of 0 to 9. 0 means no activity, 5 is considered a minor storm, and 9 is a severe geomagnetic storm. The number required for you to see the aurora depends on your latitude. I created this graphic based on maps from the University of Alaska Fairbanks Geophysical Institute. It is only an approximation of what the KP index needs to be to see aurora low on the northern horizon. But this map assumes perfect conditions:
- A clear unobstructed northern horizon with no clouds.
- Little to no light pollution to the north
- Little or no moonlight
It’s important to keep these factors in mind when attempting to view the aurora borealis. Use the map on this site to help you find a dark viewing location and make sure there are no major cities to the north. If conditions aren’t perfect (they rarely are) then the KP index needs to be higher to see the northern lights. To see the aurora overhead, you should add 2 or 3 to this map.
Reading the Charts
Planetary KP Index
The first chart on the Aurora page shows the observed KP index for the last 3 days. The downside to this chart is it only updates 8 times per day (every 3 hours). So by the time you see a geomagnetic storm is going on it may already be over.
The ‘Wing KP Index’ is more useful in my opinion. It shows the current KP index, as well as a prediction for 6 hours into the future. The white vertical dashed line represents the current time. The blue horizontal line to the left is the observed KP index over the past 6 hours. The yellow/green lines to the right are predictions of the KP index for the next 6 hours. You can compare the accuracy of past predictions (green and yellow dots/plus symbols) with what was actually observed with the blue line. The predictions are generally fairly accurate, but not always. They are based on data from the ACE satellite which orbits 1.5 million km from the Earth. This satellite measures the conditions of the solar wind and gives Earth about a 1 hour heads up.
Aurora Forecast Model
These maps are another way of checking the strength of the aurora at a glance. They are updated frequently every 5 minutes. Besides the colors on the map, the number on the top right (hemispheric power) is useful as well. Generally anything under 25 is fairly weak. 25-50 represents moderate activity and 50+ is a geomagnetic storm.
ACE Solar Wind Data
Of the 5 graphs on this chart only 3 of them are important to know when watching for aurora. The first graph has two lines on it: white and red. The white line (Bt) shows the strength of the IMF. The higher the number the better. The red line (Bz) shows the polarity of the IMF. If it is a positive (or northward) value then that is not ideal for seeing the aurora. Earth’s magnetic field will deflect most of the particles from the sun. You want this number to be negative (or southward) to cause a stronger aurora.
The orange line in the middle shows the density of the solar wind. It is measured in particles per cubic centimeter. Generally 10 or higher is ideal but this doesn’t have to be exact.
The yellow line is the speed of the solar wind in kilometers per second. It can vary from 300 km/s to 1000 km/s. A higher number usually indicates a stronger impact but geomagnetic storms can occur with lower speeds as well.
NOAA Warnings, Watches, and Alerts
At the bottom of the page is a timeline that shows any warnings, watches, and alerts from NOAA that are in effect. It can be a little confusing to read at first, but you really only need to pay attention to the bottom half of the image (Geomagnetic Sudden Impulse and Watch). When the KP index exceeds 4 NOAA will issue a warning that usually lasts between 3 and 24 hours represented by the orange and yellow lines. Once the KP index reaches 5 (the minimum to be considered a geomagnetic storm) then a different scale is used.
KP5=G1
KP6=G2
KP7=G3
KP8=G4
KP9=G5
A thick green line represents a watch when a geomagnetic storm is expected to occur. A watch can last between 24 and 72 hours because the timing is often very uncertain. About half the time a watch is posted nothing will happen. But there are also many times when the geomagnetic storm is stronger that what was predicted in the watch. If you think weather forecasts on earth are inaccurate, space weather forecasts are even more so. Trying to determine whether an explosion on the sun 93 million miles away is directed toward earth and figuring out the speed and the strength of the impact is not an easy task. But still if you see a watch posted for the next day or two then you should be prepared to possibly see the aurora. The best time for a geomagnetic storm to start is right around sunset local time because then you have all night to wait for the northern lights to appear. The worst time is around sunrise because then you have to wait many hours before it gets dark again. By the time it gets dark the geomagnetic storm may be over.
All the charts from NOAA use UTC time so you must convert it to your local time zone.
Final Notes
Hunting for the aurora from a middle latitude location (around 40°) requires a lot of patience and persistence. About half the time I go out to look for it I don’t see anything. The weather and the moon phase don’t always cooperate either. For the best chance stay out all night when geomagnetic activity is high and keep looking. Auroral substorms can brighten suddenly and then fade within minutes. But when you see that once-in-a-lifetime display of pillars rising up, exploding into color, and moving faster than you ever thought possible, it will be worth it. Good luck!
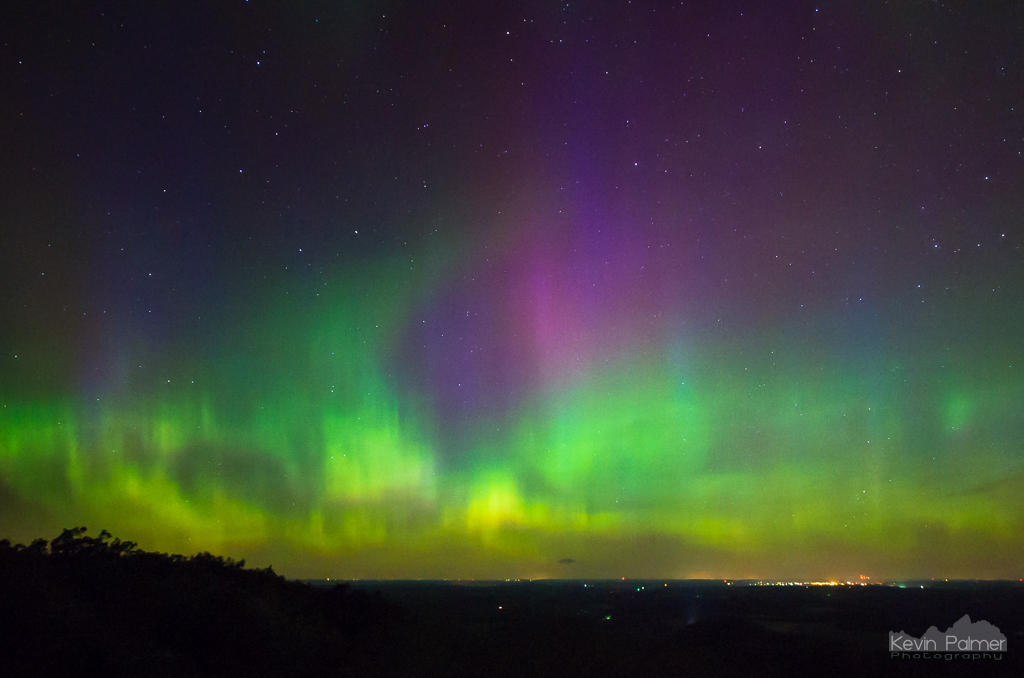
June 22nd, 2015 – This was the best display I’ve ever seen. It was viewed from Blue Mound, Wisconsin, and the KP index was 8.
Comments are closed, but trackbacks and pingbacks are open.